Welcome To Volt Active Data
Section 3 — Resiliency

4. RUN THE TEST TO MAXIMIZE CPU USAGE
As explained before, as you increase your workload you harm latency.
We’ll try 90K TPS:
- ubuntu@ip-172-31-23-37:~/voltdb-charglt/jars$ java -jar ChargingDemoTransactions.jar vdb1,vdb2,vdb3 5000000 90 600 30
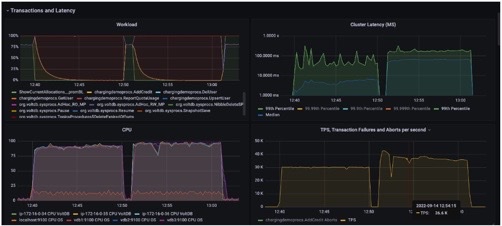
At this stage the 99th percentile latency jumps to over 140ms, but the mean latency is around 65ms. We sustain the load of 36K TPS if we use around 98% of the CPU.

Note: All of these tests were done on 4 nodes, all of which were AWS’s c5.xlarge. If you run the same tests on different AWS hardware you’ll obviously get different results.
5. USE VOLT ACTIVE DATA AS A KEY VALUE STORE
Volt Active Data can also be used as a Key Value store. In our key value store demo we show two ways this can be done:
A CONVENTIONAL KEY VALUE STORE
This where you read an object and then replace the entire object a few milliseconds later. In our case we use two procedures for each event:
GetAndLockUser returns a named user’s object, but also updates the USER_TABLE with a ‘soft lock’ – we return a custom sessionid and prevent anyone from updating the object for 50ms unless they provide our sessionId.
UpdateLockedUser updates a user if (and only if) you provide the right session id or it’s been more than 50ms locked the row. UpdateLockedUser also takes an extra parameter called ‘deltaOperationName’ that we use below.
A SMART KEY VALUE STORE
Because a Volt Active Data procedure can implement arbitrary logic using Java it can be much, much more powerful than a traditional KV store. Volt Active Data can use Java to instantiate the objects you store and make specific changes without the overhead of sending the entire object back and forth across the wire. It also means that in many cases there will be no need to ‘softlock’ the row, as the actual processing can be done as part of the call on the server, instead of on the client side.
In our example we use the following data structure:
public class ExtraUserData {
public static final String NEW_LOYALTY_NUMBER = “NEW_LOYALTY_NUMBER”; public String mysteriousHexPayload;
public String loyaltySchemeName;
public long loyaltySchemeNumber;
}
While ‘mysteriousHexPayload’ can be of arbitrary length ‘loyaltySchemeNumber’ is a Java ‘long’, and in our demo we allow you to update this field without having to send the entire row across the wire twice.
In the example below the last parameter is the proportion of updates you want to be deltas, i.e. ones where you just send the changes you want. The code to do this can be found in the RunKVBenchmark method of BaseChargingDemo.
- ubuntu@ip-172-31-23-37:~/voltdb-charglt/jars$ java -jar ChargingDemoKVStore.jar vdb1,vdb2,vdb3 2000000 15 600 60 250 50
- 2020-12-16 12:29:39:Parameters:[vdb1,vdb2,vdb3, 5000000, 15, 600, 60, 250, 50]
As the benchmark starts, you can see we start by locking users and then over time a 1:1 ratio develops between locking users and updating users.

6. ADD CREDIT USING KAFKA
Volt Active Data is closely integrated with Kafka. In our sandbox Kafka runs on the same server we logged into to run the test workloads.
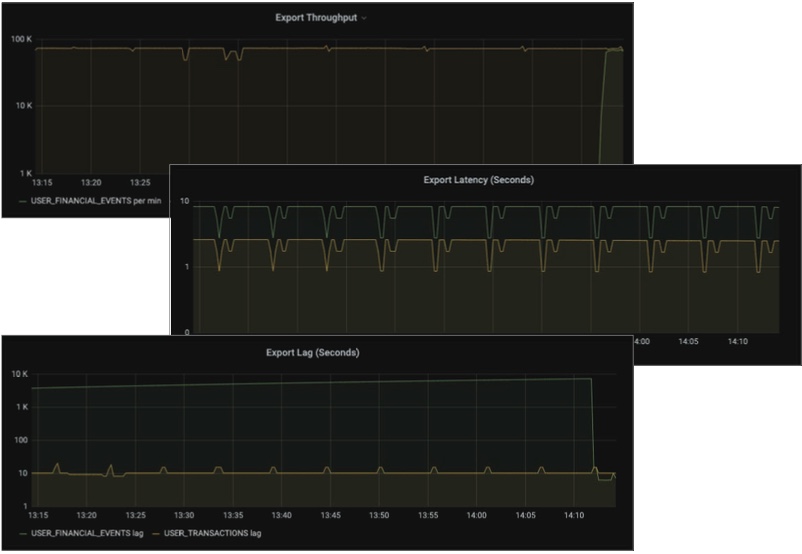
Volt Active Data can both write to Kafka and read from Kafka. In the tests we ran earlier we wrote to two Kafka queues, called user_financial_events and user_transactions. These are visible in Grafana in the ‘Volt Active Data Site O’ dashboard:

We also use Kafka to get information into Volt Active Data. The Kafka topic ADDCREDIT is passed into the stored procedure AddCredit. We can demonstrate this with KafkaCreditDemo.jar:
- buntu@ip-172-16-0-37:~/voltdb-charglt/jars$ java -jar KafkaCreditDemo.jar vdb1:9092,vdb2:9092,vdb3:9092 2000000 15 120 10000
2022-09-14 12:40:46:Parameters:[vdb1:9092,vdb2:9092,vdb3:9092, 2000000, 15, 120, 10000]
2022-09-14 12:41:00:On transaction# 1, user,amount,txnid= “1205561”,”3159″,”Kafka_0_1663159260016″
2022-09-14 12:41:00:On transaction# 10001, user,amount,txnid= “1561708”,”2939″,”Kafka_10000_1663159260907″
2022-09-14 12:41:01:On transaction# 20001, user,amount,txnid= “1565986”,”4580″,”Kafka_20000_1663159261536″
Every 10,000 transactions our Kafka code prints what it’s doing:
- 2022-09-14 12:41:35:On transaction# 230001, user,amount,txnid= “1620649”,”4315″,”Kafka_230000_1663159295723″
We can then use sqlcmd to see for ourselves:

7. LOOK AT EVENTS USING KAFKA
- buntu@ip-172-16-0-37:~/voltdb-charglt/jars$ /home/ubuntu/bin/kafka_2.13-2.6.0/bin/kafka-topics.sh –list –bootstrap-server vdb1:9092
ADDCREDIT
USER_FINANCIAL_EVENTS
We can look at them using Kafka’s built-in utilities to treat Volt as if it were Kafka:
- ubuntu@ip-172-16-0-37:~/voltdb-charglt/jars$ /home/ubuntu/bin/kafka_2.13-2.6.0/bin/kafka-console-consumer.sh –topic USER_FINANCIAL_EVENTS –from-beginning –bootstrap-server vdb1:9092 | grep -v “user created
Note that we pipe the output into a grep command to remove the several million “user created” messages at the start…
- 3360395,1058,AddCreditOnShortage_3678_1663067935961,OK
485644,1419,AddCreditOnShortage_3678_1663067935962,OK
1003331,1180,AddCreditOnShortage_3678_1663067935962,OK
4871086,1183,AddCreditOnShortage_3678_1663067935962,OK
3007055,1102,AddCreditOnShortage_3678_1663067935962,OK
3474376,0,ReportQuotaUsage_3678_1663067935963,Spent 0
1009112,1480,AddCreditOnShortage_3678_1663067935963,OK
8. KILL A NODE AND WAIT FOR IT TO REJOIN
A key feature of Volt Active Data is high availability. All of the tests you have run so far have used all 3 nodes of the 3 node cluster. The cluster has a ‘k factor’ of 1. ‘K Factor’ means ‘number of spare copies’. To get an understanding of how Volt Active Data acts during an outage we’re going to start a transactional workload and then kill one of the Volt Active Data servers.
You’ll need two ssh windows, Grafana and the Volt Active Data GUI. The Volt Active Data GUI runs on all nodes where Volt Active Data lives, so pick a node you are not planning on having an outage on.
While logged into the traffic generation server ask it to run transactions for half an hour:
- ubuntu@ip-172-31-23-37:~/voltdb-charglt/jars$ java -jar ChargingDemoTransactions.jar vdb1,vdb2,vdb3 5000000 15 1800 30
- 2020-12-16 14:41:38:Parameters:[vdb1,vdb2,vdb3, 5000000, 15, 1800, 30]
Log onto your chosen Volt Active Data server and find out the Volt Active Data process id:
- ps -deaf | grep org.voltdb.VoltDB | grep -v grep
This will be the second thing returned:

In the case above it’s 3536.
Once you are ready kill Volt Active Data and start watching the server’s log file:
- kill -9 3536 ; tail -f /voltdbdata/voltdbroot/log/volt.log
The first thing that will show up is the size of the cluster in the Volt Active Data GUI will change:

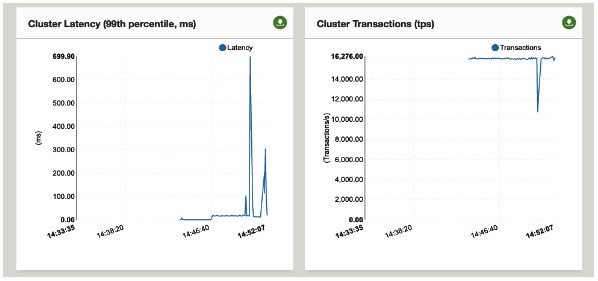
Then you will see a latency spike and a momentary drop in traffic before the workload resumes:

